
Find an optimal solution with Excel Data Table
28 Aug 2009In the current issue of OR/MS Today, I came across this nice optimization puzzle, “Bridges to Somewhere. There are these two islands. Five people A, B, C, D and F live on the first island, and need to commute to work to the second island. Individual A lives in the spot marked A, and needs to go to spot A on the second island – and so on for the 4 others. People can travel only vertically and horizontally (no diagonals), and will always take the shortest path available.
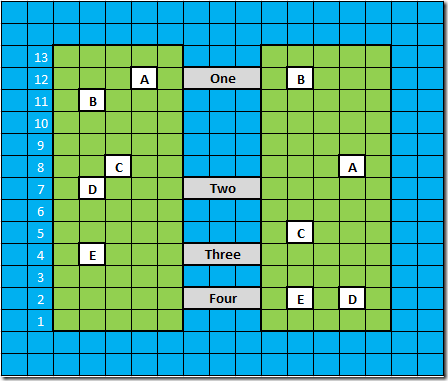
There is currently no bridge between the islands, but a budget for 2 bridges has been approved (the island just received a stimulus package). There are 4 bridge proposals to chose from (One, Two, Three and Four on the map). Which 2 bridges should be built to minimize the travel distance of the population?
Before trying to figure out which 2 bridges are best, I thought it would be interesting to investigate a simpler problem: if you could build one bridge anywhere, where should you build it?
There are a number of ways you could resolve this using Excel; I will illustrate how to find the best solution, using Excel Data Tables.
Good bridges, bad bridges
What makes a bridge better or worse for an islander?

First, note that no matter where the bridge is located, C (who I will call Charlie) needs to travel the same distance horizontally (8 squares, or 7 moves). What this means is that the horizontal position of each individual doesn’t matter: the only thing which matters is where the bridge is located, on the vertical axis.
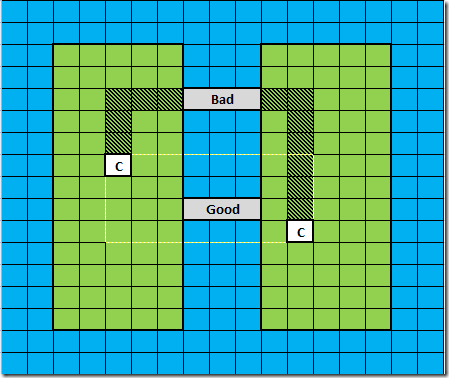
Then, any bridge located in the yellow rectangle is optimal for Charlie, who needs to travel only 4 squares down, and 8 squares right. Bridges which are located outside the bounds of the rectangle require extra vertical travel – in our example, an extra 3 squares up and 3 squares down.
Working the math, you can check that the extra travel a bridge requires from Charlie can be written as
Extra Travel = vertical distance from home to brige + vertical distance from work to bridge – vertical distance from home to work.
In our example, the Good bridge has an extra travel of 3+1-4=0 (no extra travel required), and the Bad bridge has an extra travel of 3+7-4=6.
The best bridge
Using this formula, we can now compute the extra cost of a bridge for each islander, and set up a worksheet to compute the total extra travel for each possible bridge.
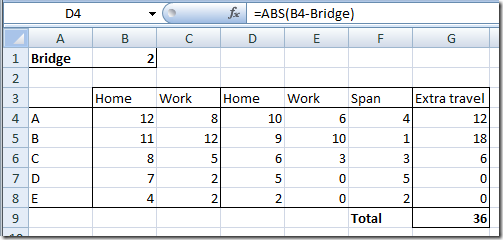
In cell B1, we enter the vertical position of the bridge, and name the range “Bridge” (I am using the coordinates that are on the first map).
In range B4:C8, we enter the vertical position of the home and workplace of each of the 5 islanders.
In columns D and E, we compute the vertical distance from home and work to the bridge as shown, and we compute the vertical distance from work to home in column F.
In column G, we compute the extra travel as G4 = D4+E4-F4, and we compute the total extra travel in G9. Entering various values in B1 will show you the value of each possible location of the bridge.
You could now use a variety of approaches to find the best solution, from trying out all solutions manually, to using the solver. I’ll illustrate how you could find the optimal solution using Data Table, one of the What-If Analysis features of Excel.
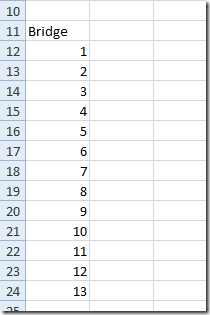
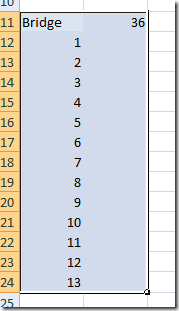
In a nutshell, a Data Table allows you to specify a range of values, and record the result of a formula in your worksheet using each of them as an input. What we will do here is try every possible location for a bridge, from 1 to 13, and record the Total Extra Travel for each scenario. First, let’s create the range of locations we want to try out:
Then, one column to the right, and one row above the input values, let’s set the formula we want to evaluate. In this case, I want to see the impact on the total extra travel, so that’s what I will set it equal to.
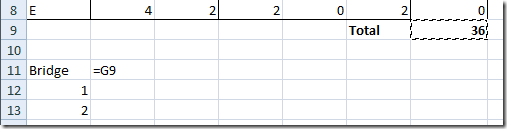
Next, select the range containing your input values and the formula:
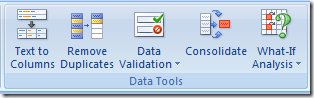
Almost there! Let’s go to Data Table in What-If Analysis…
Your input data is organized in columns, so use “Column Input Cell”, and select B1, the bridge location, which is the input value you want to replace.
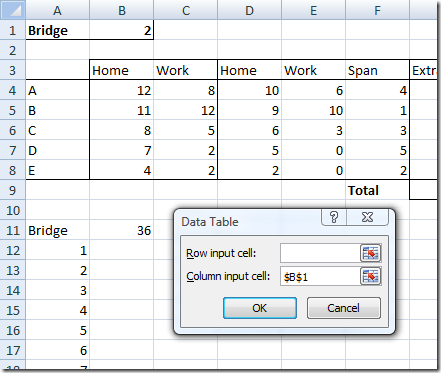
Press OK, and voila! Range B12:B24 has now been filled with data, which are the extra cost computed for each possible bridge value.
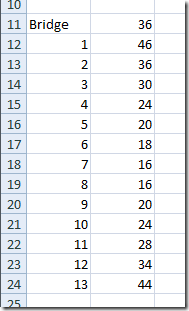
If you had one bridge to build only, you should locate it at position 7 or 8, which have the lowest extra travel for the population. Neat, no? In this example, this approach is probably not much faster that trying out various solutions by hand, but if there were more possible locations (and a less obvious solution…), this would prove very handy. Next time, we’ll see how we would go about figuring out which 2 bridges are best!