
Fun with queues, 2
14 Jan 2010In the previous installment, we discussed the dynamics of a (very) simple network of queues, and showed how much extra capacity was required to accommodate the build-up of population inside the queue, based on two factors: the rate at which people enter and leave the queue.
Today, we will look at a related question. Last time we determined the expected queue size at equilibrium, given the flow of people into the queue. This time, we want to consider the reverse problem: if you knew how many people are in the queue at equilibrium, what population breakdown would you expect between the two queues?
The question may sound theoretical – it isn’t. If you knew the total size of a market, the relative preferences of consumers between the products, and how long it takes them to replace their product, then determining how many consumers would be using each product at any given time is equivalent to the question we are considering.
 Picture from www.hackthematrix.org
Let’s illustrate on a fictional example. Imagine there is a disease, which can be treated two ways – using a blue pill, or a red pill. Doctors prescribe the blue pill to 25% of the patients, and the red one to 75%. The blue pill treatment takes 5 weeks, and the red pill treatment 8 (which we convert to average rates of exit of 0.2 and 0.125 per week). Suppose you knew that currently, 1000 people were under treatment: how many patients would you expect to be treated with a blue pill?
Using the same fixed-point approach as last time, let’s assume we are at equilibrium, and the treated population remains stable. Let’s note:
- X the total population,
- X1 and X2 the population under blue and red pill statement,
- p1 and p2 the proportion getting prescribed a blue or red pill,
- r1 and r2 the rate at which patients complete the blue and red treatments,
We get the following flow of patients exiting treatment each period:
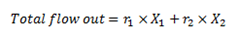
Because we are at equilibrium, as many people begin and end treatment each period, so the flow out is also the flow in. If the population in treatment 1 is stable, then its flow in and out should be equal, which leads to:
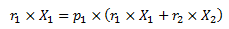
With a bit of juggling, replacing X2 by X-X1, we get:
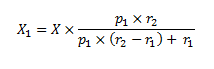
Substituting with the values, we get 172 patients under blue pill (17%), and 828 patients under red pill. The same phenomenon we discussed in the last post is at play: while 25% get prescribed the blue pill, only 17% of the total population is under that treatment, because on average this treatment is completed faster than the other one.
Assuming the overall system is at equilibrium is not an unreasonable assumption, if only because making another hypothesis would require making some additional assumptions about growth. However, you may wonder whether it’s reasonable to suppose that each treatment group is also stable. After all, you could imagine a population with a stable total of 1000, but where the number of patients treated with blue or red pills fluctuates over time.
As it turns out, this is a fairly safe assumption, and the reason is that no matter what the initial split is, over time, the repartition will converge to the equilibrium. We won’t attempt to prove it here (maybe in a later post), but we can illustrate it by simulating various initial repartitions, and see how they evolve over time.
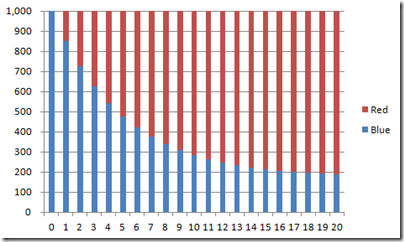
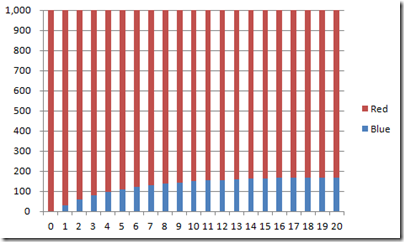
Here is what happens when the entire population is initially on Blue:
Same thing, with everyone starting on Red:
… and with an initial 50/50 mix:
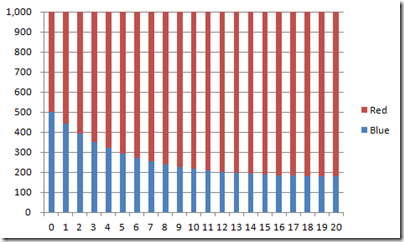
As should be visible from the charts, it’s doesn’t really matter where we start from: in the long run, the population evolves towards the share we computed. It might take longer to get there, but we’ll end there, eventually. So if the population has been stable for a while, the most reasonable assumption we can make is that it has already reached this long-term equilibrium distribution.
In the next installments, we’ll consider what we could do if the queue network was more complex, and how we could use a tool like the Excel Solver to identify an analytical solution.