
Lorentz Attactor visualization with Fable Elmish
05 Dec 2018Yesterday, I needed a bit of a break after a long day, and decided to try and visualize the Lorentz attractor in Fable. As it turns out, it wasn’t complicated, and I was pretty proud of the result, so I shared a gif on Twitter:
Sure, I could try to build something useful with @FableCompiler. Or, I could just animate the Lorentz attractor. It's entirely useless, but I could watch this thing go for hours! #fsharp pic.twitter.com/1QKGX0N6pn
— Mathias Brandewinder (@brandewinder) December 5, 2018
People of The Internet expressed interest in knowing more about this, so here we go: let’s talk about the Lorentz Attractor, F# and Fable.
The Lorentz Attractor
First, let’s start with some personal history. A long time ago, long before I knew anything about computers, I was quite interested in dynamical systems, that is, describing and understanding how systems behave over time - which is how I came across the Lorentz attractor. What makes this system interesting is that it is a fully deterministic system which, for certain settings, exhibits a chaotic behavior, which results in a beautiful shape.
Let’s talk a bit about mechanics. Per the Wikipedia entry, the Lorentz system is a system of differential equations, which describes a trajectory of a point in 3 dimensions. The differential equations are as follow:
dx/dt = sigma * (y - x)
dy/dt = x * (rho - z) - y
dz/dy = x * y - beta * z
… where
x,yandzare the 3 coordinates describing our current location,sigma,rhoandbetaare constant parameters,dx/dt,dy/dtanddz/dtis the instantaneous speed of the system along the 3 axes.
As an illustration, if we set the parameters to sigma = 10.0, beta = 8.0/3.0 and rho = 28.0, and start at position x = 10.0, y = 10.0, and z = 10.0, we can determine that the speed in the x direction is dx/dt = 10.0 * (10.0 - 10.0) = 0.0. Similarly, the speed in the y direction is 10.0 * (28.0 - 10.0) - 10.0 = 170.0.
We can’t plot the exact trajectory of the system. However, if we know the position x, y, z of the system at time t, we can approximate where it will be if we take a short step in time. If my current x position is 10.0 and my current speed dx/dt is 0.0, then after a small time the x position should not have moved. Similarly, starting at y = 10.0, dy/dt = 170.0, so I would expect that after a short time dt, say 0.01, the new y position should be approximately y + (170.0 * 0.01) = 11.7.
That’s all we need to build a simulation of a Lorentz system in F#:
let lorentz =
    let sigma = 10.
    let beta = 8. / 3.
    let rho = 28.
    fun (x, y, z) ->
        let dx = sigma * (y-x)
        let dy = rho * x - y - x * z
        let dz = x * y - beta * z
        dx, dy, dz

let nextLorentz step (x, y, z) =
    let dx, dy, dz = lorentz (x, y, z)
    x + dx * step,
    y + dy * step,
    z + dz * step
For instance, starting from position (10., 10., 10.), we can simulate 10 steps:
(10., 10., 10.)
|> Seq.unfold (fun position ->
    Some (position, nextLorentz 0.01 position))
|> Seq.take 10
|> Seq.toList
… which produces the following sequence:
[(10.0, 10.0, 10.0); (10.0, 11.7, 10.73333333);
   (10.17, 13.30966667, 11.61711111); (10.48396667, 14.8427098, 12.66091458);
   (10.91984098, 16.3024273, 13.87939494);
   (11.45809961, 17.68135065, 15.28947688);
   (12.08042472, 18.96092154, 16.90770427);
   (12.7684744, 20.11130876, 18.74739201);
   (13.50275784, 21.09161256, 20.81536886);
   (14.26164331, 21.85081978, 23.10824173)]
Isometric Projection
We have a working Lorentz system now, but this isn’t pretty. Can we visualize this?
One problem here is that this sequence unfolds in 3 dimensions, and our screen is sadly 2 dimensional. We need a way to project onto the screen.
The diagram below illustrates how one would probably go about representing the point (1., 1., 1.) on the 2-dimensional surface of a sheet of paper:
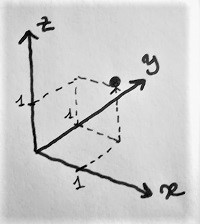
With a bit of trigonometry, and hoping I didn’t do any calculation mistake here, the X and Y positions of the projected point on the sheet can be reconstructed as:
X = x * cos (x_axis_angle) + y * cos (y_axis_angle) + z * cos (z_axis_angle)`
Y = x * sin (x_axis_angle) + y * sin (y_axis_angle) + z * sin (z_axis_angle)`
Which translates quite naturally to F#:
open System
let PI = Math.PI

let xAngle = 3. * PI / 4.
let yAngle = PI / 4.
let zAngle = PI / 2.

let project (x, y, z) =
    let X =
        x * cos xAngle +
        y * cos yAngle +
        z * cos zAngle
    let Y =
        x * sin xAngle +
        y * sin yAngle +
        z * sin zAngle
    X, Y
Putting it all together in Fable
Warning: if you are looking for best practices, this is not the place to find it. I am entirely incompetent in all things web, and just slapped things together to get pretty pictures moving.
We now have all the tools we need, time to do some pretty graphics, using Fable Elmish. All I did was clone the Fable2 samples repo, go to the minimal project, follow the instructions to get it to build, and start hacking at it.
Instead of plotting the entire trajectory, what I wanted to do was to keep a “trace” of, say, the 200 hundred last positions, dropping the last point every time a new one was calculated. I define Dot3D as a 3D dot, a tuple of 3 floats, and maintain in the Model an array of dots I want to display, as well as how many of them I should keep in Trace, and the size of the surface I want to project onto, so I can rescale the image appropriately:
type Dot3D = float * float * float

type Model = {
    Trace: int
    Dots: Dot3D []
    Width: float
    Height: float
    }
We define one message, NextDot, which signals that a new dot is being added, and initialize our model:
type Msg =
    | NextDot

let init () : Model =
    {
        Trace = 300
        Dots = [| 10., 10., 10. |]
        Width = 440.
        Height = 380.
    }
The update, quick-and-dirty style, computes a new dot, adds it to the collection, and drops the tail:
let update (msg:Msg) (model:Model) =
    match msg with
    | NextDot ->
        let previous = model.Dots.[0]
        let next = nextLorentz 0.01 previous
        { model with
            Dots =
                Array.append
                 [| next |]
                 (model.Dots |> Array.truncate model.Trace)
        }
And, because that’s the only thing I know how to work with, we can plot our dots as white circles on a black rectangle, using SVG:
let view (model:Model) dispatch =

    div
        []
        [
            svg
                [ SVGAttr.Width(model.Width); SVGAttr.Height(model.Height) ]
                [
                    yield
                        rect [ SVGAttr.Width(model.Width); SVGAttr.Height(model.Height); SVGAttr.Fill("black")] []

                    for dot in model.Dots ->
                        dot
                        |> project
                        |> scale (model.Width, model.Height)
                        |> fun (x, y) ->
                            circle [
                                SVGAttr.Cx(x)
                                SVGAttr.Cy(y);
                                SVGAttr.R(1);
                                SVGAttr.Fill("white")
                                ] []
                ]
        ]
Finally, we need a new point to be generated on a timer, so we add that:
let timer initial =
    let sub dispatch =
        window.setInterval(
            (fun _ -> dispatch NextDot),
            10
            )
        |> ignore

    Cmd.ofSub sub

// App
Program.mkSimple init update view
|> Program.withReact "elmish-app"
|> Program.withSubscription timer
|> Program.withConsoleTrace
|> Program.run
… and we are done.
If you want to play with this or see it in action, I created a gist here with the full code. You can just copy the code and paste it into the awesome Fable REPL, and it should just work.
That’s it! Let me know if you have questions and comments :)