Fun with queues
07 Jan 2010I am currently prototyping an application, which brought up some fun modeling questions.
Imagine the following situation: there are 2 products on the market. Customers use either of them, but not both. In each time period (we consider a discrete time model), new customers come on the market, and select one of the 2 products, with probability p and (1-p). At the end of each period, some existing customers stop using their product, and leave the market, with a rate of exit specific to the product.
Suppose that you knew p and the rates of exit for each product. If the size of the total market size was stable, what market share would you expect to see for each product?
Before tackling that question, let’s start with an easier problem: if you knew how many new customers were coming in each period, what would you expect the product shares to be?
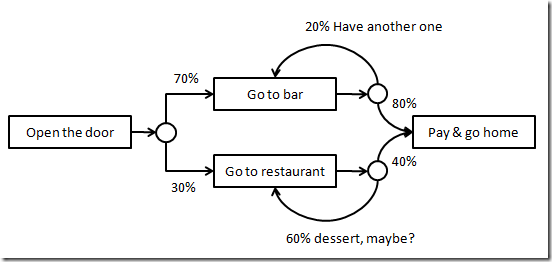
Let’s illustrate with an example. You want to open the Awesome Bar & Restaurant, an Awesome place with a large bar and dining room. You expect that 100 customers will show up at the door every hour. A large majority of the customers (70%) head straight to the bar, but one the other hand, people who come for dinner stay for much longer. How many seats should you have in the bar and the restaurant so that no one has to wait to be seated?

What makes this question interesting is that both queues, in the bar and restaurant, will build up over time. If 100 persons enter the restaurant at time t, at time t+1, 60 of them will still be there – and if you had only 100 tables available, the new wave of customers coming in will have to wait to be seated. We clearly need more than 100 seats to keep customers happy.
How can we approach that problem? We are looking for a fixed point, a solution Population = [Population(Bar); Population(Restaurant)] which is invariant over time, so that
f([Bar, Restaurant]) = [Bar, Restaurant]
Practically, this means that we expect the number of people sitting at the bar to stay constant over time – which implies that for each period, there should be as many people entering and leaving the bar.
If N people enter the Awesome Place at time t, the number of people entering the bar is proportion(Bar) x N.
If the population at the bar at time t is Population(Bar), then the number of people exiting will be Population(Bar) x Exit Rate(Bar).
Equating the number of people coming and leaving the bar, we get:
Total Customers Entering x Proportion (Bar) = Population(Bar) x Exit Rate(Bar)
Which gives us
Population(Bar) = Customers Entering x Proportion(Bar) / Exit Rate(Bar)
or, in our specific example,
Population(Bar) = 100 x 0.7 / 0.8 = 87.5
Population(Restaurant) = 100 x 0.3 / 0.4 = 75
Total = 162.5 seats
What did we just see here? First, even though only 100 customers are coming in every hour, because some people stay in each place more than one hour, we actually need to build much more capacity than 100 – in our case, we need a total of 163 seats if we want to seat customers without wait time.
Then, while 70% of customers head for the bar, they leave much faster than restaurant customers, and thus don’t require that much space: at any given time, only 54% of the customers should be at the bar.
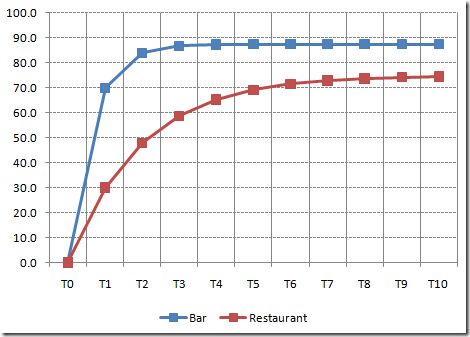
I plotted below how the place would fill up over time, starting empty. The chart shows that both queues converge to the “stable values” we identified. However, while the bar gets there fairly quickly, the restaurant takes much more time to fill up. The reason for this is the low exit rate: because people stay longer, a larger buffer of free seats is required, and initially filling that buffer takes time.

In the next installments, we’ll look at this in more depth – addressing the original question, and maybe digging deeper into related questions, like the impact of random fluctuations, or what happens if the market is growing, or if we consider more complex queues!
