
Generate all outcomes of a binary tree with Excel
28 Jun 2010A client asked me recently a fun probability question, which revolved around figuring out the probability of success of a research program. In a simplified form, here is the problem: imagine that you have multiple labs, each developing products which have independent probabilities of succeeding – what is the probability of more than a certain number of products being eventually successful?
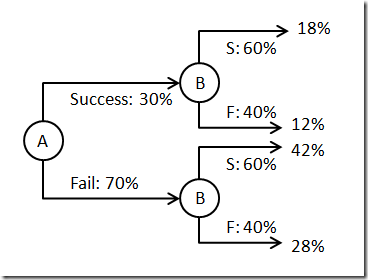
Let’s illustrate on a simple example. Product A has a 30% probability of success, and product B a 60% probability of success. Combining these into a probability tree, we work out that there is an 18% chance of having 2 products successful, 18% + 12 % + 42% = 72% chance of having 1 or more products succeed, and 28% chances of a total failure.
It’s not a very complicated theoretical problem. Practically, however, when the number of products increases, the number of outcomes becomes large, fairly fast – and working out every single combination by hand is extremely tedious. Fortunately, using a simple trick, we can generate these combinations with minimal effort. The representation of integers in base 2 is a decomposition in powers of 2, resulting in a unique sequence of 0 and 1. In our simplified example, if we consider the numbers 0, 1, 2 and 3, their decomposition is
0 = 0 x 2^2 + 0 x 2^1 –> 00
1 = 0 x 2^2 + 1 ^ 2^1 –> 01
2 = 1 x 2^2 + 0 x 2^1 –> 10
3 = 1 x 2^2 + 1 x 2^2 –> 11
As a result, if if consider a 1 to encode the success of a product, and a 0 its failure, the binary representation of integers from 0 to 3 gives us all possible outcomes for our two-products scenario.
Excel has a handy function available, DEC2BIN, which generates the binary representation of an integer. Let’s see how we can leverage this to generate all the outcomes of a 5-products scenario. We simply enter 0 to 31 in the column A of our spreadsheet (0 to 2^5-1 possible combinations), and enter in the next column =DEC2BIN(A2,5), where 5 represents the number of places we want, i.e. how many 0 and 1s we want displayed. The result looks like this:
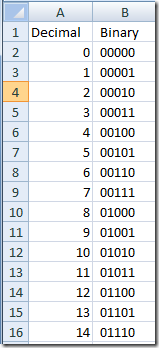
You can see how column B progressively enumerates every 5 “character” combination of 1 and 0, which we will interpret as successes and failures.
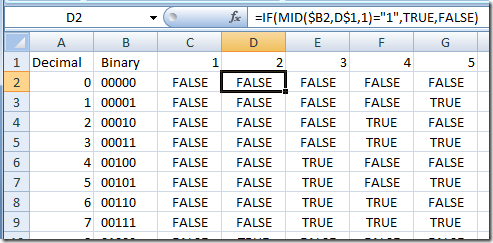
We can now easily retrieve the state of each product in each of the branches. We need to read the number in column B, and if the 2nd character in that column is a 1, the 2nd product is successful, which we express using the MID function:
=IF(MID($B2,D$1,1)="1",TRUE,FALSE)
Now we can work out the probability of each scenario, by multiplying together the probabilities of success or failure, based on the state of each product.
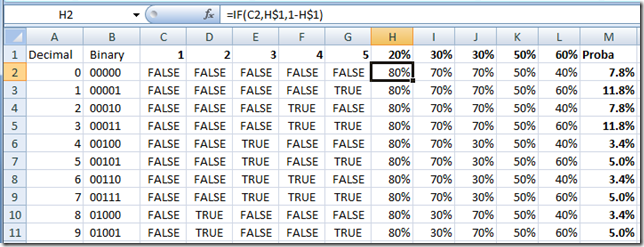
At that point, we can compute fairly easily anything we want. For instance, if we wanted to know the probability that at least 3 products end up succeeding, we would simply count the cases where we have at least 3 successes in columns C to G. Using =COUNTIF(C2:G2,TRUE) we can count the number of successes, and =IF(COUNTIF(C2:G2,TRUE)>2,M2,0) will filter cases where more than 2 products succeed, retrieve the probability of the scenario if that condition is met; and summing up these probabilities will give us the overall probability of our scenario of interest.