
Explore and Visualize models with F# and FSharpChart
11 Sep 2011The project I am currently working on involves developing a forecasting model. Starting from an initial estimate, the model will progressively update its forecast as time goes by and real data becomes available.
The process of developing such a model is iterative by nature: you design the mechanics of a forecasting algorithm, look at how it would have performed on historical data, fine-tune the design and parameters based on the results, and rinse & repeat.
The problem I started running into is the “look at how it would have performed on historical data”. There is plenty of data available, which is both a blessing and a curse. A blessing, because more data means better validation. A curse, because as the amount of data increases, it becomes difficult to navigate through it, and focus on individual cases.
So far, my approach has been to create metrics of fit between a model and a set of data, and to run a model against large sets of data, measuring how well the model is doing against the data set. However, I still don’t have a good solution for digging into why a particular case is not working so well. What I would like to achieve is to identify a problematic case, and explore what is going on, ideally by generating charts on the fly to visualize what is happening. Unfortunately, the tools I am using currently do not accommodate that scenario well. Excel is great at producing charts in a flexible manner, but my model is .NET code, and I don’t have a convenient, lightweight way to use C# code in Excel. Conversely, creating exploratory charts from C# is somewhat expensive, and requires a lengthy cycle: write code for the chart, compile (and lose whatever is loaded in memory), observe – and repeat.
I am currently exploring an alternative, via F# and FSharpChart. F# offers a very interesting possibility over C#, F# Interactive (fsi). Fsi is a REPL (Read, Evaluate, Print Loop), which allows you to type in code interactively in the console and execute it as you go. The beauty of it is that you can experiment with code live, without having to go through the code change / recompile cycle. Add to the mix FSharpChart, a library/script which wraps .NET DataVisualization.Charting and makes it conveniently usable from F#, and you get a nice way to write .NET code and generate charts, on the fly.
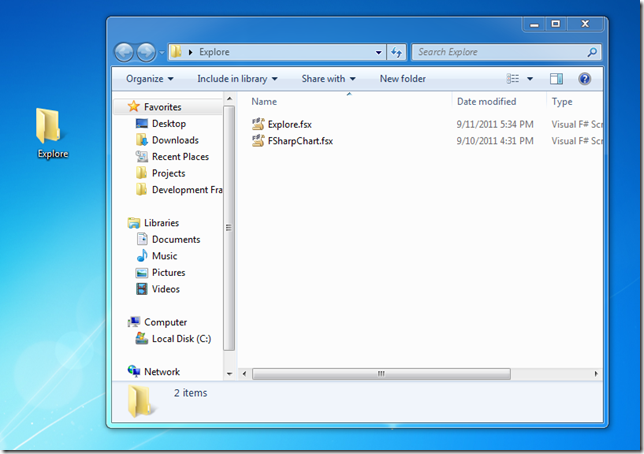
Let’s illustrate on a simple example. Suppose I have a model that simulates sales following a Poisson process, and want to check whether this “looks right”. First, let’s download FSharpChart, create a folder called “Explore” on the Desktop, and copy the FSharpChart.fsx script file into that folder. Then, let’s create an empty text file called Explore.fsx in the same folder, which we will use to experiment with code and charts, and save whatever snippets come in handy at the time.
Next, let’s double-click on the Explore.fsx file, which will then be opened in Visual Studio, and type in the following:
#load @"C:\Users\Mathias\Desktop\Explore\fsharpchart.fsx"

open System
open System.Drawing
open MSDN.FSharp.Charting

let random = new Random()

// Simulate a Poisson distribution with parameter lambda
let poisson lambda =
    let L = Math.Exp(-lambda)
    let rec simulate (k,p) =
        if p > L then simulate (k + 1, p * random.NextDouble())
        else k - 1
    simulate (0, 1.0)

let sales lambda periods = [
    for i in 1.0 .. periods -> (i, poisson lambda) ]
The first line loads the FSharpChart script from the location we copied it into, making the charting capabilities available to us. The next three load up the namespaces we will need.
The poisson function is used to generate a Poisson distribution, following Knuth’s algorithm. The sales function simulates sales over a certain number of periods, assuming a rate of sales per period of lambda.
Now that we have a model, we can start playing with it. Send the whole code to the interactive window, wait for the script to load – and start typing:
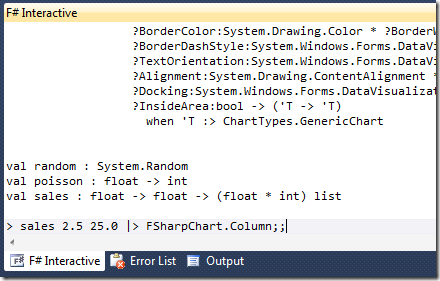
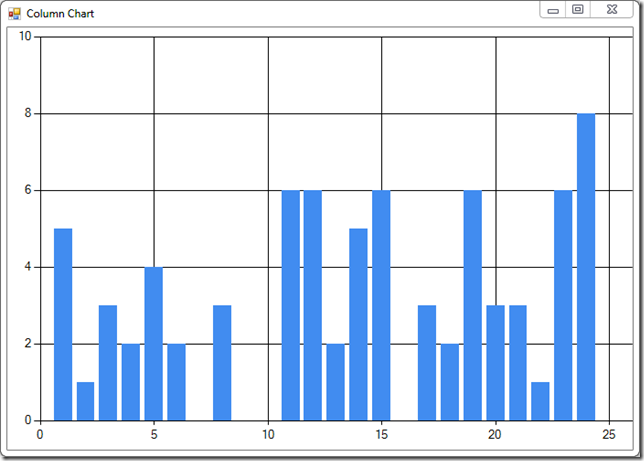
Hit Enter, here we have it – a column chart representing our simulated sales:
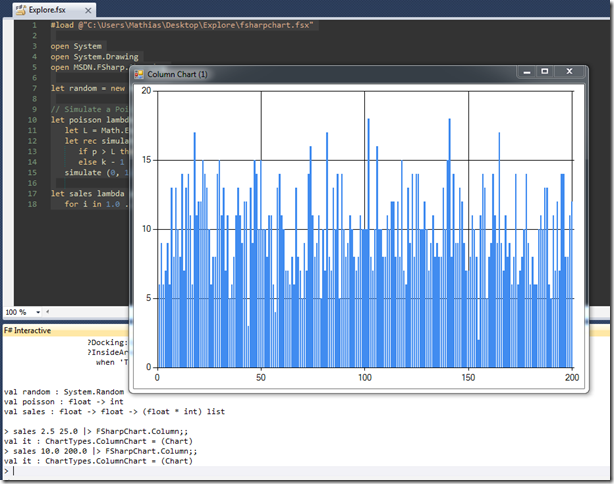
How about different values? Let’s try a lambda of 10, over 200 periods – just type in fsi, and we are set:
My experimentations are still early stage, but I am very interested in exploring this further. FSharpChart supports a ton of chart types, and gives me the ability to generate whatever I want to look at at the time, using .NET code, all from within Visual Studio. The example I went through was generating simulated data, but in principle, I should also be able to re-use existing C# code that deals with retrieving existing historical data. More on this in the next few weeks, I suspect!
Resources
You can find FSharpChart here. Carl Nolan, the author of the library, has some documentation on his blog.
Getting Started with the FSharpChart Library, which is an excerpt of “Real-World Functional Programming” (Tomas Petricek & Jon Skeet), is an excellent resource.