
Nearest Neighbor Classification, part 1
29 Jul 2012Machine Learning in Action, in F#
Porting Machine Learning in Action from Python to F#
- KNN classification (1)
- KNN classification (2)
- Decision Tree classification
- Naive Bayes classification
- Logistic Regression classification
- SVM classification (1)
- SVM classification (2)
- AdaBoost classification
- K-Means clustering
- SVD
- Recommendation engine
- Code on GitHub
With all sorts of people waving around the term “Machine Learning” lately, I figured it was time to look into what the fuss was about, so I purchased “Machine Learning In Action”. I am mostly enjoying the book so far, with one inconvenience: all the code presented is in Python, which is easy enough to follow, but not directly useful to me. The best way to learn is to get your hands dirty and code, so I am planning on converting the Python examples into F# as a progress through - which should also be a good exercise in learning more F#.
Chapter 2 of the book covers classification using k-Nearest Neighbors. The idea behind the algorithm is fairly straightforward: given a dataset of numeric observations, each observation being classified in a group, the algorithm will classify a new observation based on what group most of its close neighbors belong to. The book uses a linear algebra library in its implementation. It seemed like overkill for the situation, so I’ll go for raw F# here.
Let’s first create a new F# library project, and start working on a script, creating a fictional dataset like this:
let createDataSet =
    [| [| 1.0; 0.9 |]
       [| 0.8; 1.0 |]
       [| 0.8; 0.9 |]
       [| 0.0; 0.1 |]
       [| 0.3; 0.0 |]
       [| 0.1; 0.1 |] |],
    [| "A"; "A"; "A"; "B"; "B"; "B" |]
createDataSet returns a Tuple with two elements. First, we create an Array of Arrays, an Array containing 6 observations on 2 fictional variables. The second element is also an Array, containing the Label of the group the observation belongs to. For instance, the first observation was [ 1.0; 0.9 ], and it belonged to group A.
It would be helpful to visualize the dataset, to get a sense for the structure of the data. One option to do this is FSharpChart, a lightweight charting library which works fairly well with the F# interactive window. The easiest way to use it is by adding it to our project via NuGet, which adds a reference to MSDN.FSharpChart. We need to add a reference to FSharpChart to the script, with a reference to the path where NuGet downloaded the libraries (this post by Don Syme provides a great example) - we are now ready to add a scatterplot function to the script:
#r @"C:\Users\Mathias\Documents\Visual Studio 2010\Projects\MachineLearningInAction\packages\MSDN.FSharpChart.dll.0.60\lib\MSDN.FSharpChart.dll"

open MSDN.FSharp.Charting

let createDataSet =
    [| [| 1.0; 0.9 |]
       [| 0.8; 1.0 |]
       [| 0.8; 0.9 |]
       [| 0.0; 0.1 |]
       [| 0.3; 0.0 |]
       [| 0.1; 0.1 |] |],
    [| "A"; "A"; "A"; "B"; "B"; "B" |]

let scatterplot (dataset: float[][]) =
    dataset
    |> Array.map (fun e -> e.[0], e.[1])
    |> FSharpChart.FastPoint
    |> FSharpChart.Create
The scatterplot simply takes a dataset, maps each observation to a tuple of X and Y coordinates, and passes it to FSharpChart.FastPoint, which produces a… scatterplot. Let’s select all that code, send it to F# interactive, and start playing in fsi:
> let data, labels = createDataSet
scatterplot data;;

val labels : string [] = [|"A"; "A"; "A"; "B"; "B"; "B"|]
val data : float [] [] =
  [|[|1.0; 0.9|]; [|0.8; 1.0|]; [|0.8; 0.9|]; [|0.0; 0.1|]; [|0.3; 0.0|];
    [|0.1; 0.1|]|]
At that point, you should see a chart popping up, looking like this one:
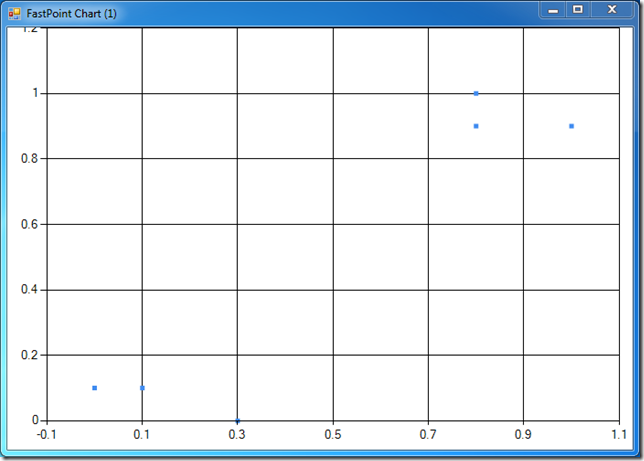
Our 6 observations are there. However, this isn’t very informative - it would be nice to also see what group each point belongs to, maybe with some colors and labels. I had a few problems with that part, here is the code I came up with:
let display (dataSet: float[][]) (labels: string []) i j =

    let byLabel =
        dataSet
        |> Array.map (fun e -> e.[i], e.[j])
        |> Array.zip labels

    let uniqueLabels = Seq.distinct labels

    FSharpChart.Combine
        [ for label in uniqueLabels ->
                let data =
                    Array.filter (fun e  - > label = fst e) byLabel
                    |> Array.map snd
                FSharpChart.Point(data) :> ChartTypes.GenericChart
                |> FSharpChart.WithSeries.DataPoint(Label=label)
        ]
    |> FSharpChart.Create
dataSet and labels match what we have done so far; I added two arguments, i and j, which represent what variable to plot. byLabel takes the dataset and labels, and packages each observation in a tuple, where the first element is the label of the observation, and the second the X and Y coordinates we will display.
Then we create a combination chart: we create an individual series for each individual label, by filtering the observations matching each label, and generating a Point series, adding a Label to each individual observation. Note the ugly static upcast of each Point chart to a GenericChart - I struggled quite a bit with that one, because FSharpChart.Combine would complain about the Chart type. The other thing that is needed here is a reference to System.Windows.Forms.DataVisualization.dll (#r @"System.Windows.Forms.DataVisualization.dll"), and open System.Drawing.
Let’s try that bad boy out in fsi again:
> let data, labels = createDataSet;;

val labels : string [] = [|"A"; "A"; "A"; "B"; "B"; "B"|]
val data : float [] [] =
  [|[|1.0; 0.9|]; [|0.8; 1.0|]; [|0.8; 0.9|]; [|0.0; 0.1|]; [|0.3; 0.0|];
    [|0.1; 0.1|]|]

> display data labels 0 1;;
val it : ChartData.DataSourceCombined =
  MSDN.FSharp.Charting.ChartData+DataSourceCombined
>
This is much more useful - we see that group A is lying in the upper-right quadrant, whereas group B is in the lower-left area:

Now that we know what we are dealing with, let’s go classify. The procedure is pretty simple: to classify a new subject based on the dataset, we compute the distance between the subject and every observation in the set, pick the k closest observations, and take a majority vote in this set of k nearest neighbors.
The price to pay for not using a Linear Algebra library is that I can’t directly compute the difference between two vectors - I have to write my distance function by hand.
Here is what I came up with:
let distance v1 v2 =
    Array.zip v1 v2
    |> Array.fold (fun sum e -> sum + pown (fst e - snd e) 2) 0.0
    |> sqrt

let classify subject dataset labels k =
    dataset
    |> Array.map (fun row -> distance row subject)
    |> Array.zip labels
    |> Array.sortBy snd
    |> Array.toSeq
    |> Seq.take k
    |> Seq.groupBy fst
    |> Seq.maxBy (fun g -> Seq.length (snd g))
The distance function simply takes two arrays of doubles, computes the sum of the square of the differences of each element by folding, and takes the square root of the total, which is the Eucliean distance.
classify maps each row of the dataset (an observation) with its distance to the subject we want to classify. Once that’s done, we zip the distances with the observation label, sort by distance, take the k first elements, group them by labels, and take the group with the largest number of elements.
Running this in fsi again, here is what we get:
> let data, labels = createDataset;;

val labels : string [] = [|"A"; "A"; "A"; "B"; "B"; "B"|]
val data : float [] [] =
  [|[|1.0; 0.9|]; [|0.8; 1.0|]; [|0.8; 0.9|]; [|0.0; 0.1|]; [|0.3; 0.0|];
    [|0.1; 0.1|]|]

> classify [| 0.2; 0.4 |] data labels 3;;
val it : string * seq<string * float> =
  ("B", seq [("B", 0.316227766); ("B", 0.3605551275); ("B", 0.4123105626)])
>
Based on our dataset and 3 neighbors, the algorithm “classifies” the subject [ 0.2; 0.4 ] as a “B”, with an overwhelming majority (the largest group of neighbors contains 3 Bs).
Given the layout of our sample, this makes sense. Let’s try a position in the middle:
> classify [| 0.7; 0.4 |] data labels 3;;
val it : string * seq<string * float> =
  ("A", seq [("A", 0.5099019514); ("A", 0.5830951895)])
This time, the subject is classified in group A, with only two As in its vicinity, out of 3 neighbors.
That’s all for today! Next time, I’ll go into the rest of “Machine Learning In Action Machine Learning In Action”, chapter 2, trying the algorithm on more interesting examples, and dealing with data normalization.
Here is the complete Script so far:
// Replace this path with the location where NuGet (or you) installed MSDN.FSharpChart:
#r @"C:\Users\Mathias\Documents\Visual Studio 2010\Projects\MachineLearningInAction\packages\MSDN.FSharpChart.dll.0.60\lib\MSDN.FSharpChart.dll"
#r @"System.Windows.Forms.DataVisualization.dll"

open System.Drawing
open MSDN.FSharp.Charting

let createDataset =
    [| [| 1.0; 0.9 |]
       [| 0.8; 1.0 |]
       [| 0.8; 0.9 |]
       [| 0.0; 0.1 |]
       [| 0.3; 0.0 |]
       [| 0.1; 0.1 |] |],
    [| "A"; "A"; "A"; "B"; "B"; "B" |]

let display (dataset: float[][]) (labels: string []) i j =

    let byLabel =
        dataset
        |> Array.map (fun e -> e.[i], e.[j])
        |> Array.zip labels

    let uniqueLabels = Seq.distinct labels

    FSharpChart.Combine
        [ for label in uniqueLabels ->
                let data =
                    Array.filter (fun e -> label = fst e) byLabel
                    |> Array.map snd
                FSharpChart.Point(data) :> ChartTypes.GenericChart
                |> FSharpChart.WithSeries.DataPoint(Label=label)
        ]
    |> FSharpChart.Create

let distance v1 v2 =
    Array.zip v1 v2
    |> Array.fold (fun sum e -> sum + pown (fst e - snd e) 2) 0.0
    |> sqrt

let classify subject dataset labels k =
    dataset
    |> Array.map (fun row -> distance row subject)
    |> Array.zip labels
    |> Array.sortBy snd
    |> Array.toSeq
    |> Seq.take k
    |> Seq.groupBy fst
    |> Seq.maxBy (fun g -> Seq.length (snd g))