25 Nov 2012
Machine Learning in Action, in F#
Porting Machine Learning in Action from Python to F#
I am still working my way through “Machine Learning in Action”, converting the samples from Python to F#. I am currently in the middle of chapter 6, dedicated to Support Vector Machines, which has given me more trouble than the previous ones. This post will be sharing my current progress: the code I have so far is a working translation of the naïve SVM implementation, presented in the first half of the chapter. We’ll get to kernels, and the full Platt SMO algorithm in a later post - today will be solely discussing the simple, un-optimized version.
Two factors slowed me down with this chapter: the math, and Python.
The math behind the algorithm is significantly more involved than the other algorithms, and I won’t even try to go into why it works. I recommend reading An Idiot’s guide to SVMs, which I found a pretty complete and accessible explanation of the theory behind SVMs. I will focus instead on the implementation, which was in itself a bit challenging.
First, the Python code uses algebra quite a bit, and I found that deciphering what was going on required a bit of patience. Take a line like the following:
fXi = (float)(multiply(alphas, labelMat).T*(dataMatrix*dataMatrix[i,:].T))+b
I am reasonably well versed in linear algebra, but figuring out what this is saying takes some attention. Granted, I have no experience with Python and NumPy, so my whining is probably a bit unfair. Still, I thought the code was not very readable, and it motivated me to see if that could be improved, and as a result I ended up moving away from heavy algebra notation.
More...
10 Nov 2012
The Kaggle/StackOverflow contest officially closed a few days ago, which makes it a perfect time to have a miniature retrospective on that experience. The objective of the contest was to write an algorithm to predict whether a StackOverflow question would be closed by moderators, and the reason why.
The contest was announced just a couple of days before what was supposed to be 4 weeks of computer-free vacation travelling around Europe. Needless to say, a quick change of plans followed; I am a big fan of StackOverflow, and Machine Learning has been on my mind quite a bit lately, so I packed my smallest laptop with Visual Studio installed. At the same time, the wonders of the Interwebs resulted in the formation of Team Charon - the awesome @lu_a_jalla and me, around the loosely defined project of “having fun with this, using 100% F#”.
Now that the contest is over, here are a few notes on the experience, focusing on process and tools, and not the modeling aspects – I’ll get back to that in a later post.
More...
31 Oct 2012
This post is to be filed in the “useless but fun” category. A friend of mine was doing some Hadoopy stuff a few days ago, experimenting with rather large sparse matrices and their products. Long story short, we ended up wondering how sparse the product of 2 sparse matrices should be.
A sparse matrix is a matrix which is primarily filled with zeros. The product of two matrices involves computing the dot product of each row of the first one, with each column of the second one. There is clearly a relationship between how dense the two matrices are, and how dense the result should be. As an obvious illustration, if we consider 2 matrices populated only with zeroes - as sparse as it gets - their product is obviously 0. Conversely, two matrices populated only with ones - as dense as it gets - will result in a “completely dense” matrix. But… what happens in between?
Should I expect the product of 2 sparse matrices to be more, or less dense than the original matrices? And does it depend on how large the matrices are? What would be your guess?
More...
30 Sep 2012
Machine Learning in Action, in F#
Porting Machine Learning in Action from Python to F#
After four weeks of vacations, I am back home, ready to continue my series of posts converting the samples from Machine Learning in Action from Python to F#.
Today’s post covers Chapter 5 of the book, dedicated to Logistic Regression. Logistic Regression is another classification method. It uses numeric data to determine how to separate observations into two classes, identified by 0 or 1.
The entire code presented in this post can be found on GitHub, commit 398677f
The idea behind the algorithm
The main idea behind the algorithm is to find a function which, using the numeric data that describe an individual observation as input, will return a number between 0 and 1. Ideally, that function will return a number close to respectively 0 or 1 for observations belonging to group 0 or 1.
To achieve that result, the algorithm relies on the Sigmoid function:
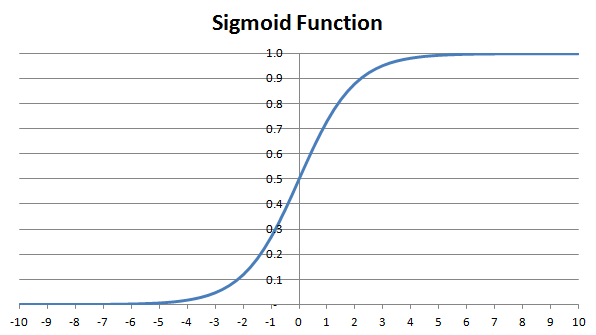
For any input value, the Sigmoid function returns a value in ] 0 ; 1 [. A positive value will return a value greater than 0.5, and the greater the input value, the closer to 1. One could think of the function as returning a probability: for very high or low values of x, there is a high certainty that it belongs to one of the two groups, and for values close to zero, the probability of each group is 50% / 50%.
The only thing needed then is a transformation taking the numeric values describing the observations from the dataset, and mapping them to a single value, such that applying the Sigmoid function to it produces results close to the group the observation belongs to. The most straightforward way to achieve this is to apply a linear combination: an observation with numeric values [ x1; x2; ... xk ] will be converted into w0 + w1 x x1 + w2 x x2 ... + wk x xk, by applying weights [ w0; w1; ... wk ] to each of the components of the observation.
Note how the weights have one extra element w0, which is used for a constant term.
If our observations had two components X and Y, each observation can be represented as a point (X, Y) in the plane, and what we are looking for is a straight line w0 + w1 x X + w2 x Y, such that every observation of group 0 is on one side of the line, and every observation of group 1 on the other side.
We now replaced one problem by another - how can we find a suitable set of weights W?
More...
22 Aug 2012
In my recent post on Decision Tree Classifiers, I mentioned that I was too lazy to figure out how to visualize the Decision Tree “supporting” the classifier. Well, at times, the Internet can be an awesome place. Cesar Mendoza has forked the Machine Learning in Action GitHub project, and done a very fine job resolving that problem using the Microsoft Automatic Graph Layout library, and running it on the Lenses Dataset from the University of California, Irvine Machine Learning dataset repository.
Here is the result of the visualization, you can find his code here:

Unfortunately, as far as I can tell, the library is not open source, and requires a MSDN license. The amount of great stuff produced at Microsoft Research is amazing, it’s just too bad that at times licensing seems to get in the way of getting the word out…
More...