24 Aug 2014
My recollection of how this all started is somewhat fuzzy at that point. I remember talking to @tomaspetricek about the recent “A pleasant round of golf” with @relentlessdev event in London. The idea of Code Golf is to write code that fits in as few characters as possible – a terrible idea in most cases, but an interesting one if you want to force your brain into unknown territory. Also, a very fun idea, with lots of possibilities. If I recall correctly, the discussion soon drifted to the conclusion that if you do it right (so to speak), your code should fit in a tweet. Tweet, or GTFO, as the kids would say (or so I hear).
More...
31 Jul 2014
It is the summer, a time to cool off and enjoy vacations – so let’s keep it light, and hopefully fun, today! A couple of days ago, during his recent San Francisco visit, @tomaspetricek brought up an idea that I found intriguing. What if you had two images, and wanted to recreate an image similar to the first one, using only the pixels from the second?
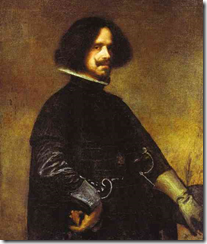
To make this real, let’s take two images - a portrait by Velasquez, and one by Picasso, which I have conveniently cropped to be of identical size. What we are trying to do is to re-arrange the pixels from the Picasso painting, and recombine them to get something close to the Velasquez:

More...
16 Jun 2014
Like many a good man, I too got caught into the 2048 trap, which explains in part why I have been rather quiet on this blog lately (there are a couple other reasons, too).
In case you don’t know what 2048 is yet, first, consider yourself lucky - and, fair warning, you might want to back away now, while you still have a chance. 2048 is a very simple and fun game, and one of the greatest time sinks since Tetris. You can play it here, and the source code is here on GitHub.
More...
12 Apr 2014
A lightweight post this week. One of my favorite F# type providers is the World Bank type provider, which enables ridiculously easy access to a boatload of socio-economic data for every country in the world. However, numbers are cold – wouldn’t it be nice to visualize them using a map? Turns out it’s pretty easy to do, using another of my favorites, the R type provider. The rworldmap R package, as its name suggests, is all about world maps, and is a perfect fit with the World Bank data.
The video below shows you the results in action; I also added the code below, for good measure. The only caveat relates to the integration between the Deedle data frame library and R. I had to manually copy the Deedle.dll and Deedle.RProvider.Plugin.dll into packages\RProvider.1.0.5\lib for the R Provider to properly convert Deedle data frames into R data frames. Enjoy!
More...
22 Mar 2014
A couple of days ago, I got into the following Twitter exchange:
So why do I think FsCheck + XUnit = The Bomb?
More...